TCTravConnect
Retail intelligence

The shelf now has a funnel, so you can design the conversion

We turn what happens in front of an offline shelf into data. Impression, click, choice, shopper — the moment that used to leave nothing behind but a sales figure, now split into four measurable steps.

No CCTV, no sensors, no signage — it runs on the shopper's own phone

BACKGROUND

Stores are becoming ad media, but the shelf itself is still unmeasured

Korea's major retailers are scaling up retail media, yet offline measurement still stops at a handful of stores and at ad impressions.

Retailer G · convenience

100 / 5,000

In-store media across ~5,000 stores, but only ~100 measured with AI cameras

Retailer C · convenience

3,000

~3,000 stores with signage; performance analysis began in 2026 via a telco ad platform

Retailer E · hypermarket

+20%

Retail media revenue up ~20% year on year, expanding into warehouse-format stores

Retailer O · health & beauty

CPC

Performance ads at the product level, lowering the entry bar for small budgets (in-app)

※ Based on company announcements and press coverage (2024–2026)

The ad budget is arriving in stores — but what happens at the shelf is still invisible

01 WHY

Online measures every click. The shelf leaves only a sales figure

The impression, the click and the choice that happen right before purchase are recorded nowhere.

ImpressionClickChoiceRevenue
Online advertisingMeasuredMeasuredMeasuredMeasured
The shelf todayUnknownUnknownUnknownSales only
TravConnectTimes the product was capturedProduct and campaign clicks, CTRPick, compare card, social shareLinked to sales data

If all you see is what sold, you will never learn why the rest didn't.

MARKET MAP

Visits, impressions and purchases are measured. Product choice is the gap

How offline data and retail media are measured in Korea today

Per visit

Who came in, and where did they linger?

How

CCTV video analytics, Wi-Fi location data

Limit

No idea which product they actually picked up

Per ad impression

Who saw the ad, and how often?

How

In-store digital signage

Limit

Only some stores can measure it; the link to purchase is weak

Per purchase

Who bought what?

How

Loyalty receipts, in-app commerce

Limit

No view of why they didn't buy, or what they chose instead

Per product choice

What did they look at, choose — and choose instead?

How

A scan from the shopper's phone, via TravConnect

Strength

SKU-level with no installation, down to country and taste type

We don't replace your existing data — we fill the empty "chosen vs. not chosen" layer

02 HOW

One scan becomes data for the brand and for the retailer

TravPick helps shoppers decide at the shelf; TravConnect turns that behaviour into insight and ad inventory.

Shopper

Photographs the shelf

Scan

TravPick

AI that picks for you

Behaviour data

TravConnect

Funnel data and advertising

Insight and campaigns

Brand and retailer

Act on the shelf with data

A better shelf

A better shelf invites the next scan — the loop turns every day.

TravPick

AI that picks for you

Taste-based recommendations · 16 taste types · 30 languages across 170 countries

TravConnect

The dashboard for the shelf funnel

Analytics · Smart Report · Campaigns

TravPick Club

Our Seongsu store, validating this daily

~1,300 visitors a day · brands selected from 400+ applicants

How the money flows·Brand ad spend → TravConnect → revenue share to the retailer

Online turned clicks into revenue. Here, the scan at the shelf does the same

COMPARISON

No installation — choice and alternatives, product by product

Unit of measurement, infrastructure required, and how it is billed

CCTV video analyticsIn-store signageIn-app commerce adsTravConnect
Measured unitVisit, zoneAd impression, viewerOnline click, purchaseProduct (SKU) choice and alternatives
InstallationCCTV plus analytics hardwareDisplaysNone (online)None (the shopper's phone)
Shopper attributesGender, ageGender, age (some stores)Loyalty dataCountry, age, taste type
Why they didn't buy××Partial (drop-off)○ What they chose instead
BillingSubscription, contractMonthly slotCPCSubscription + CPM/CPC + revenue share

※ TravConnect's sample is shoppers who use TravPick. In-store QR codes and brand-led distribution widen that sample.

No CCTV, no sensors, no signage — the shelf itself becomes the measurement point

03 WHAT

From impression to shopper, the whole shelf funnel in one dashboard

Are you seen, do you hold attention, are you chosen, and by whom — metrics for each step, plus suggestions for what to fix.

1

Impression

Is our product actually visible on the shelf?

Impressions · country · retail channel

2

Click

Did it hold their attention?

Product clicks · campaign CTR

3

Choice

Did they pick it — and if not, what did they pick?

Pick Rate · top 10 alternatives · head-to-head comparison

4

Shopper

Who are the people choosing it?

Country · age · taste type · time of day · heatmap

Real screens from TravPick

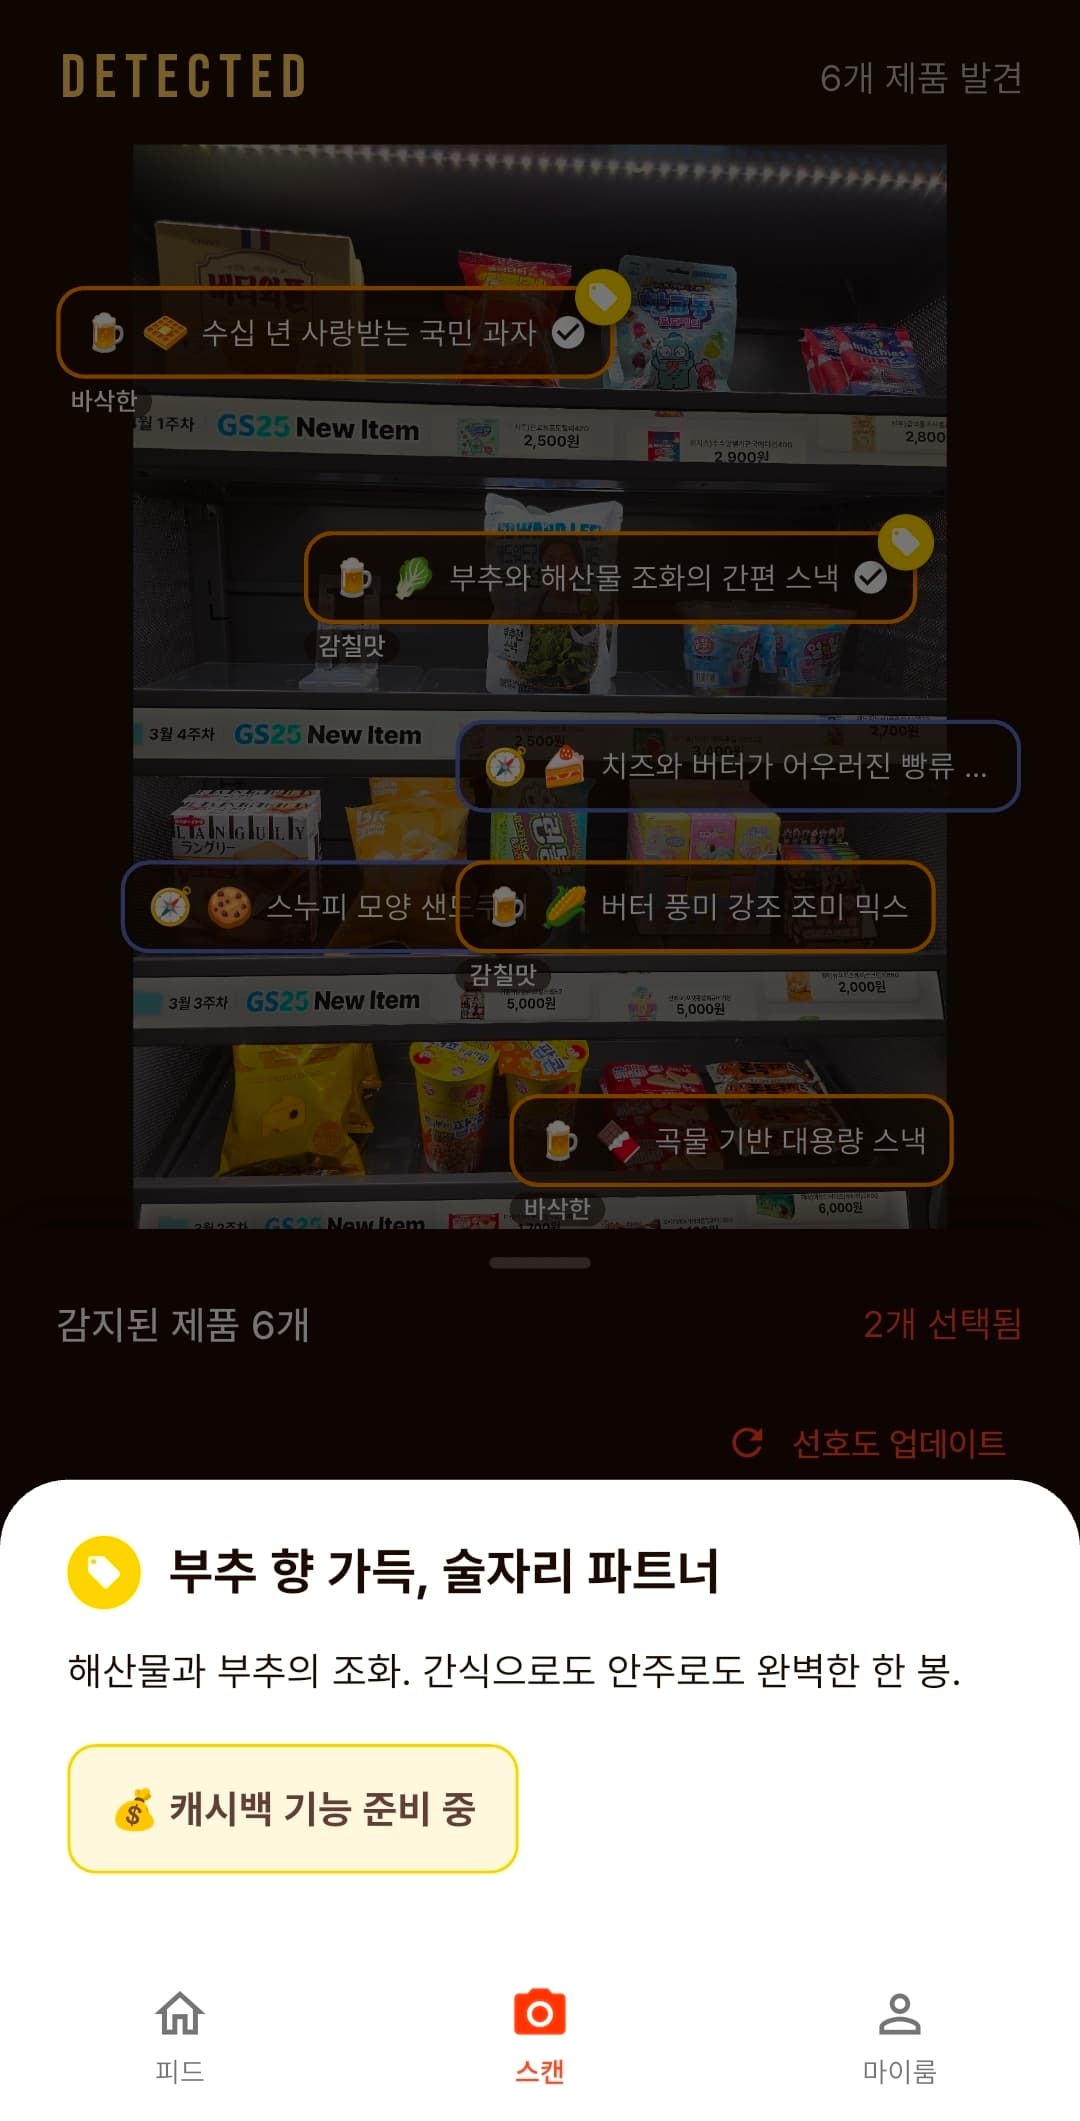
Shelf scan + promotion
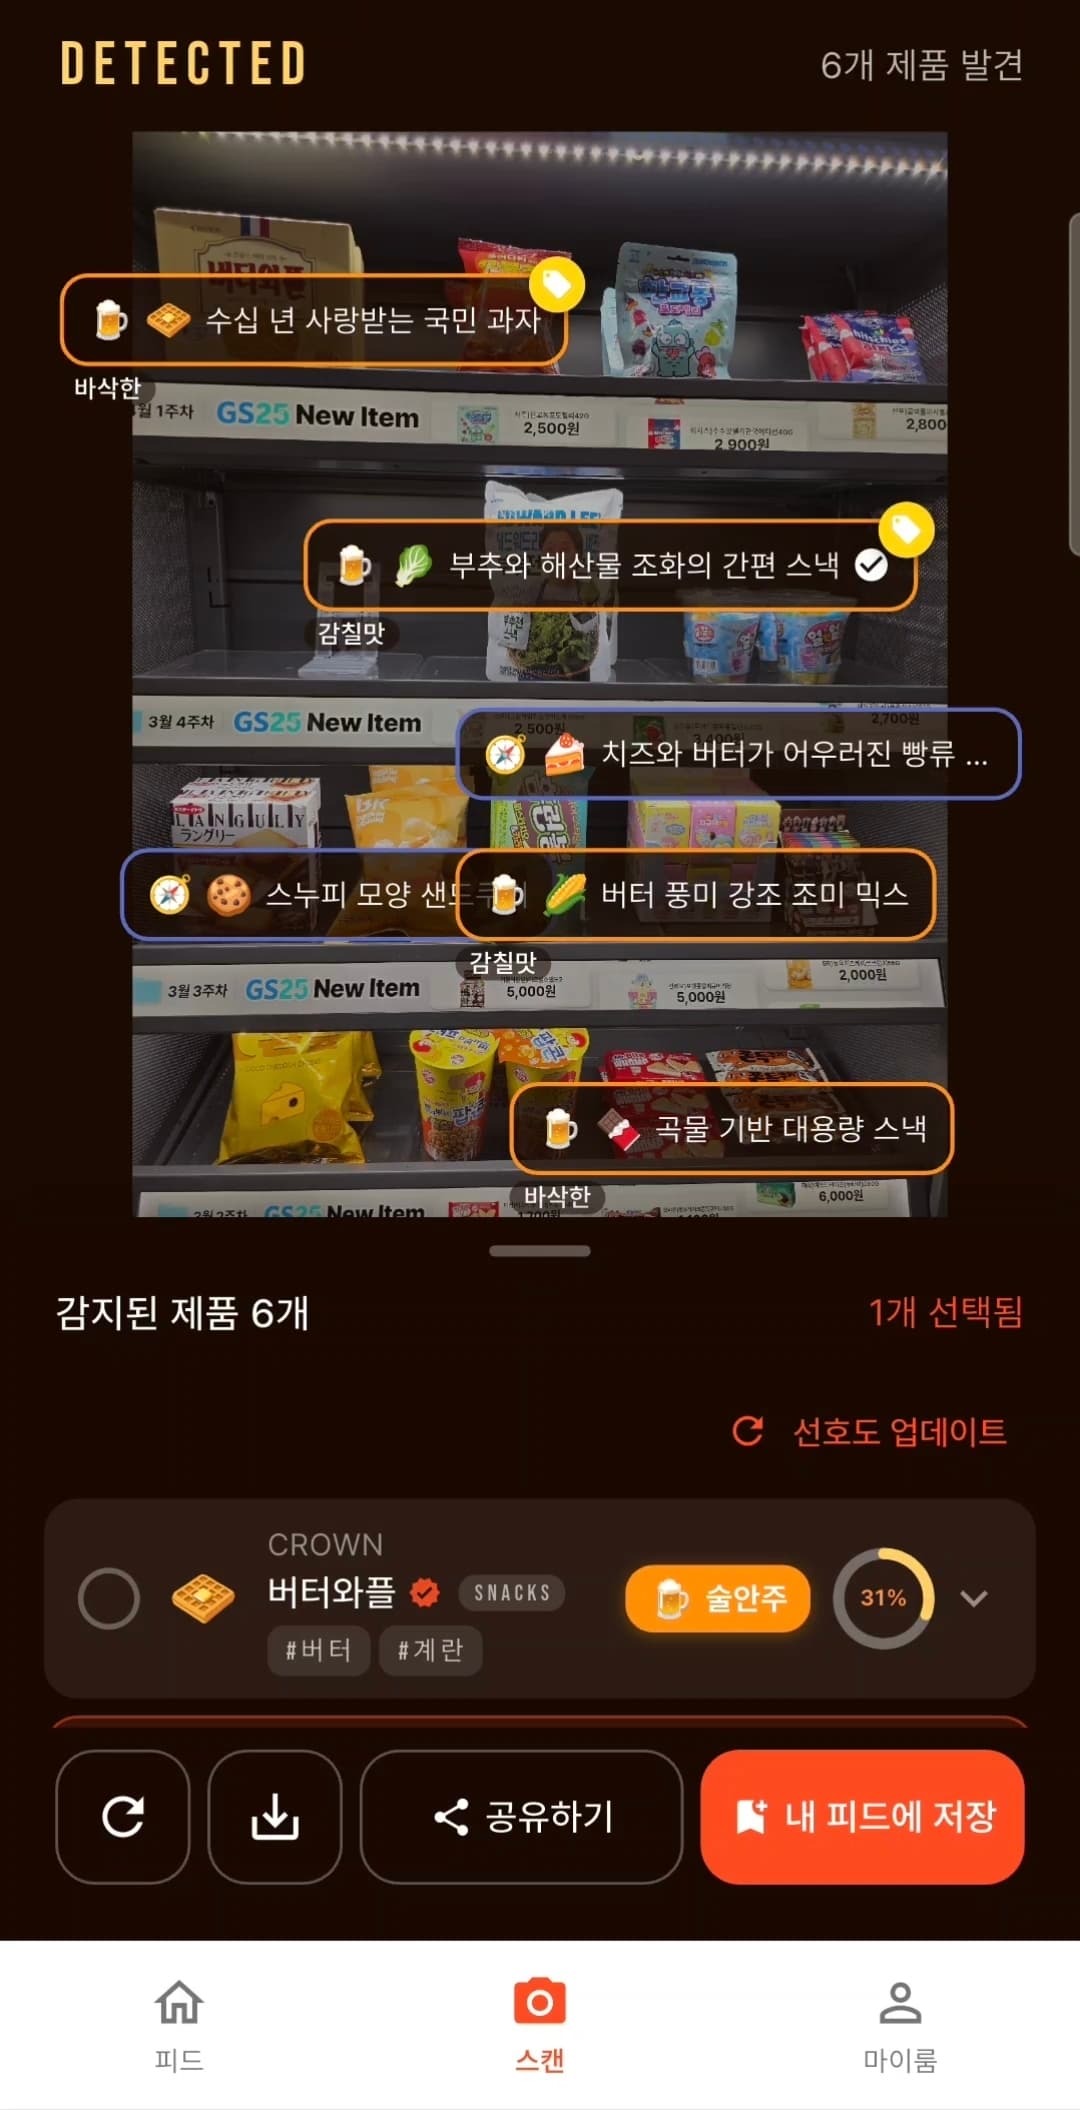
AI product recognition
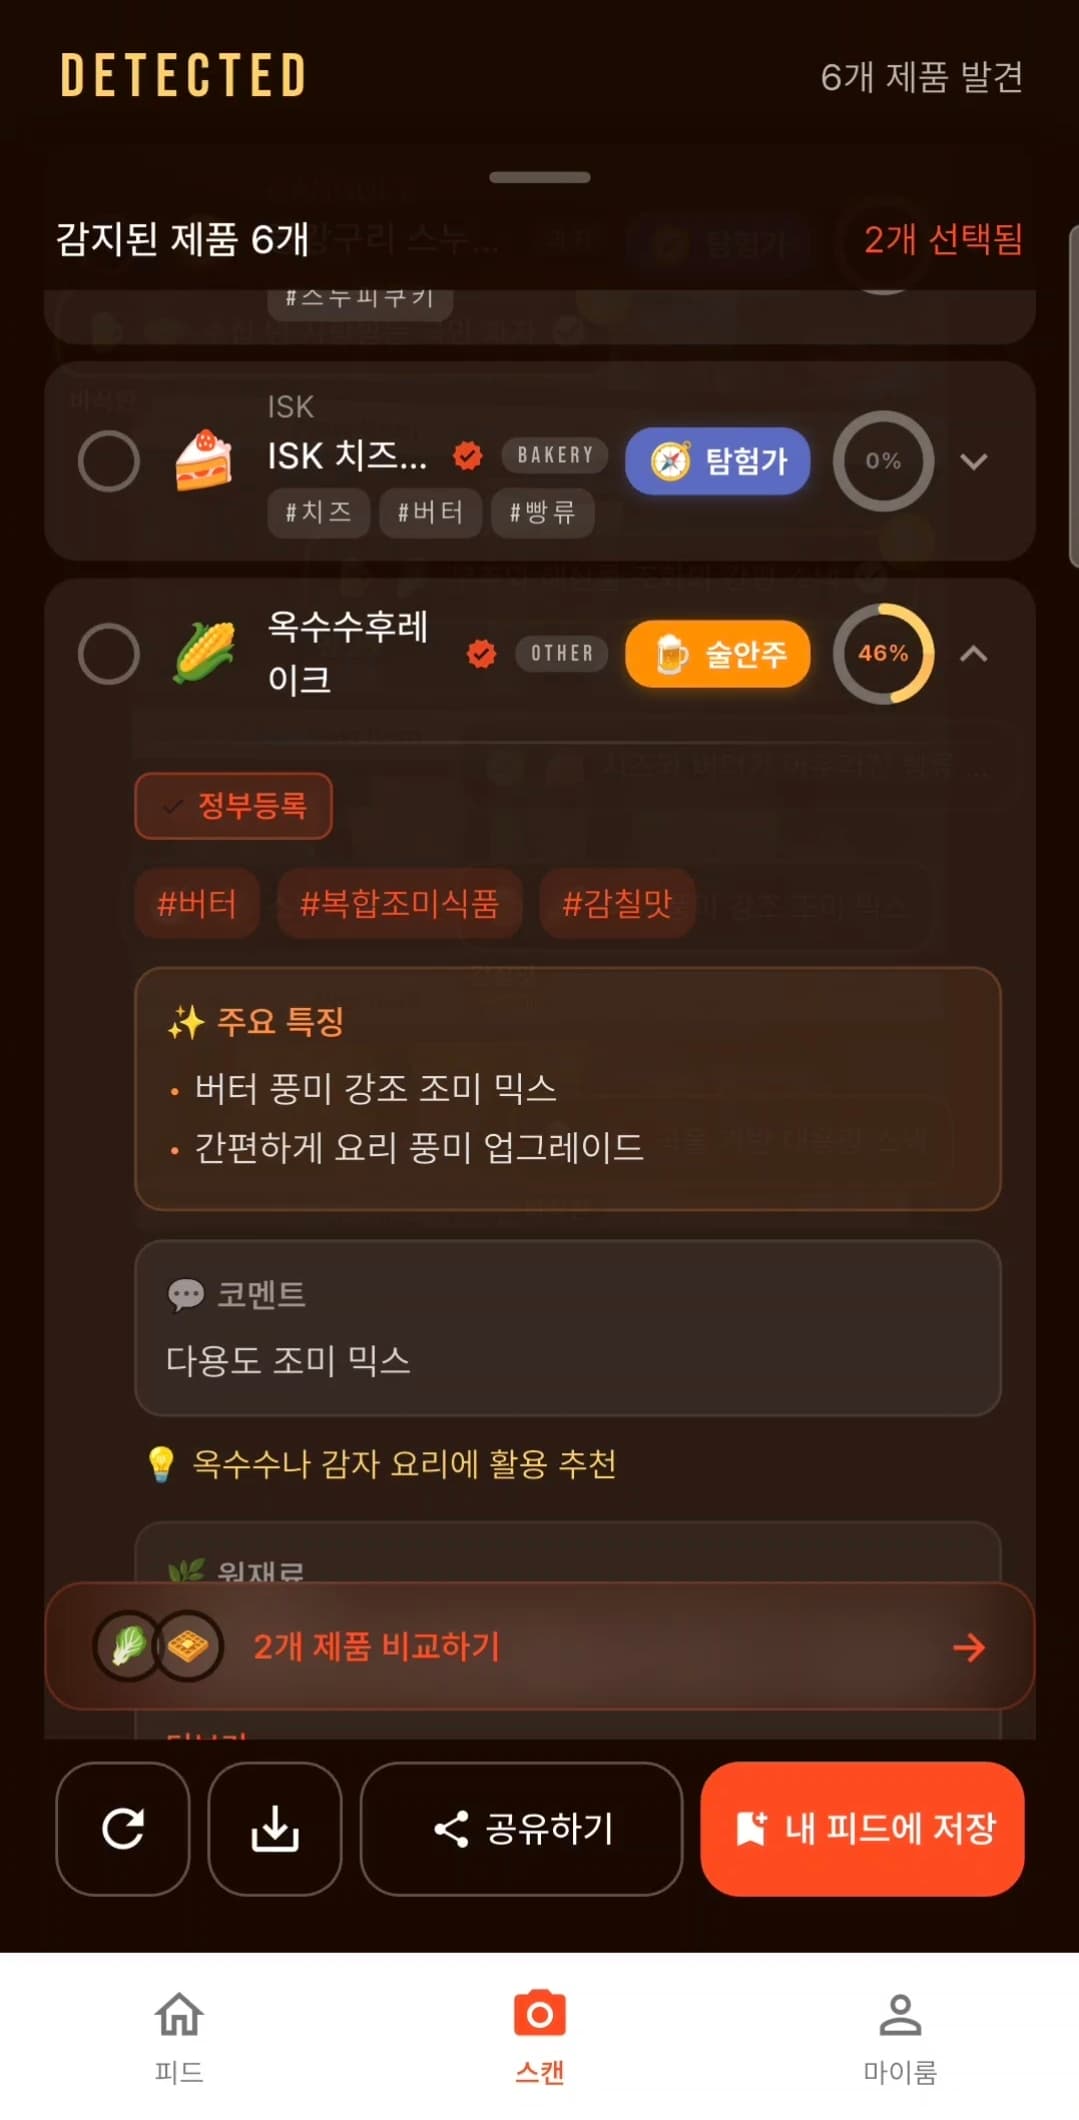
Product detail
Product detail
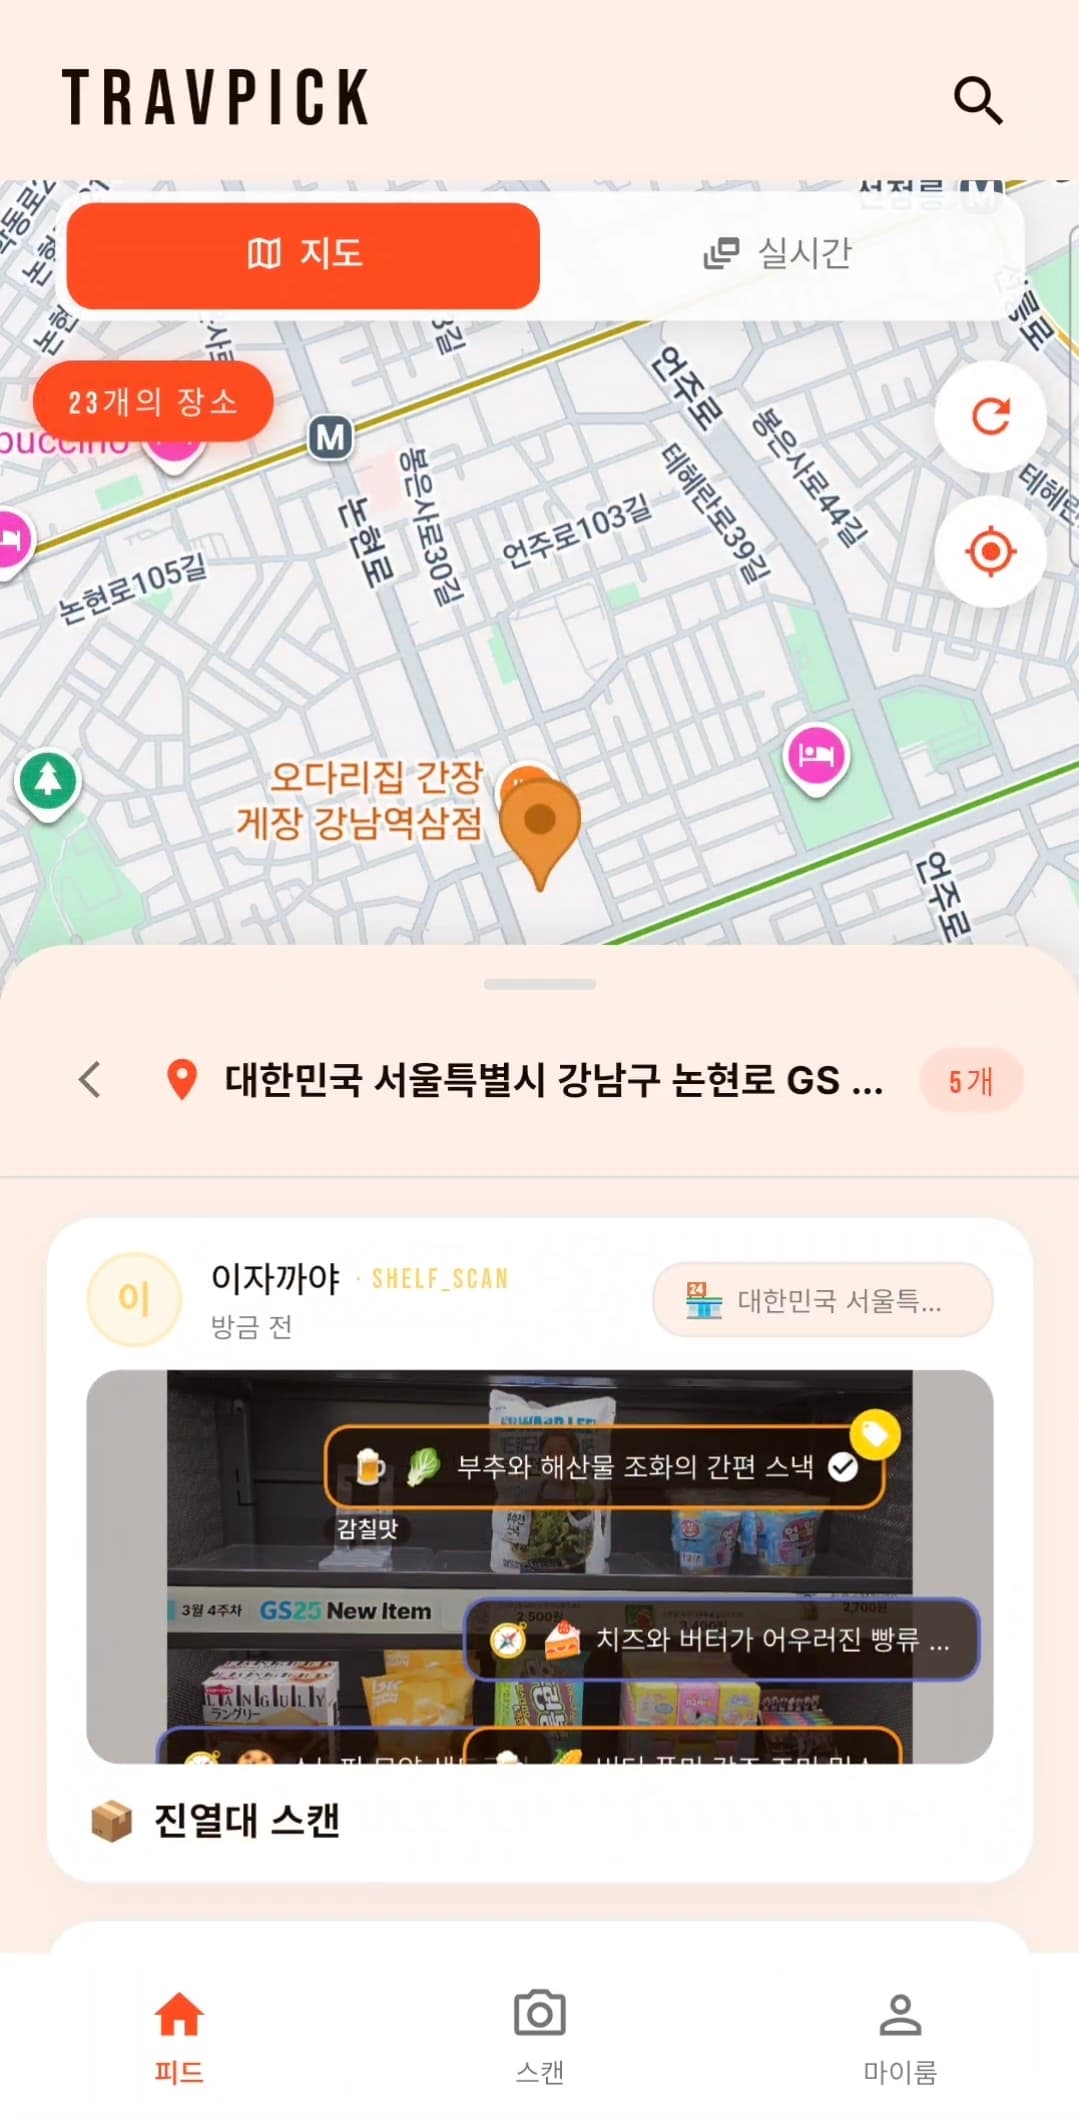
Location & feed
Location & feed

Smart Report walks you from what it found, to what it means, to what to try, to doing it

Which side are you on?

BRAND · OFFER

Read the shelf data, then advertise at the moment of the scan

Dashboard subscription plus shelf campaigns (CPM or CPC)

Dashboard subscription

  • The four funnel steps: impression, click, choice, shopper
  • Top 10 products chosen instead of yours, plus head-to-head comparison
  • Country, age, taste type, time of day, heatmap
  • Smart Report: automatic suggestions on what to improve

※ Terms depend on the number of products and the store footprint

Shelf campaigns

CPM or CPC
  • Your campaign appears on the scan result screen
  • Targeting by country and retail channel, with three A/B variants
  • Prepaid ad wallet, with daily and total budget settings
  • A daily impression cap per shopper

※ Message-style offers only (a free gift, for example). No discounts or coupons. Results are not guaranteed.

The data you read and the ads you run, in one dashboard

BRAND CASE

Before you cut the price, find out why you were passed over

Drop-off, targeting, channel — three brand decisions rewritten by shelf data

Find where you lose them, and choice rate rises without a discount

Brands that traced the switch to a competitor and rewrote their copy and line-up

Skincare · indieBrand A

30 ml soothing serum · drugstore and a Seongsu concept store

The problem
Three months in, sell-out was half that of a rival serum in the same zone. Internally it was read as a price problem, and a buy-one-get-one promotion was on the table.
What TravConnect showed
Head-to-head comparison: click-through was similar, but Pick Rate was 11% vs 24%. The number-one alternative was that rival serum (42% of the drop-off). The rival led with concentration — "5% panthenol" — while A used abstract copy like "gentle soothing". They were losing on information, not price.
What they did
The promotion was shelved. The product description on the scan result screen was rewritten around ingredients and concentration ("72% centella extract · fragrance-free · skin irritation tested"), and the English copy was restructured to match.
11→19%
Pick Rate (4 weeks)
42→29%
Drop-off to the rival
Suncare · mid-sizeBrand B

50 ml tone-up sunscreen

The problem
Ahead of summer, the sales team asked for a price cut on competitiveness grounds.
What TravConnect showed
Two of the top three alternatives were 70 ml large-format products at the same price point. The cheaper option ranked seventh. By country, Southeast Asian shoppers dropped off most. They were losing on value for volume, not on price.
What they did
Instead of cutting the price, they planned a 70 ml large-format SKU and ran a CPC message campaign for Southeast Asian shoppers: "The amount you use daily — one bottle, one season."
−30%
Drop-off to alternatives
+9pp
Pick Rate in SE Asia

Narrow the target and the same budget gets chosen more often

Brands that tightened targeting and creative using country, taste type and time-of-day data

Colour · lipBrand C

Velvet lip tint, 8 shades

The problem
Marketing ran on domestic influencer seeding. Foreign shoppers' reactions were known only through store staff.
What TravConnect showed
Japan led scans at 38%. Among taste types, "cool-tone, everyday natural" had a Pick Rate 2.1× the average. Two of the eight shades captured 60% of all picks.
What they did
They uploaded Japanese product imagery and narrowed the campaign to Japan and those two shades, with three A/B variants (shade / longevity / gift). The shade angle won: 4.1% CTR against a 1.9% average. Seeding creators in Japan were re-selected around the same taste type.
2.1×
Pick Rate, Japanese shoppers
4.1%
CTR of the winning creative
Skincare · sheet masksBrand D

10-sheet mask pack

The problem
A CPM campaign ran evenly across all regions and ages, and CTR had stalled below 1%.
What TravConnect showed
Time-of-day analysis put 62% of scans between 6pm and 9pm, and 71% of shoppers in their twenties. The heatmap clustered in two districts, Seongsu and Myeongdong — the after-work pattern of picking "something for tonight".
What they did
They switched from CPM to CPC and capped impressions at two per shopper per day to manage fatigue. Creative was rewritten around the moment of use: "One sheet tonight, better skin tomorrow morning."
0.8→1.5%
CTR
−35%
Ad cost per equivalent click
+6pp
Pick Rate for the product

Shelf data brings channel and new-product decisions forward

Brands that chose a retail channel and a new product from choice rates and shopper pick lists

Hair & body · new productBrand E

Perfumed body wash

The problem
They had to choose between convenience stores and drugstores for their first offline channel, with nothing concrete to bring to the buyer meeting.
What TravConnect showed
In the retail channel tab, three weeks after launch, drugstore Pick Rate was 23% against 9.5% in convenience stores — a 2.4× gap. In drugstores, the alternatives chosen were mostly imported body washes: a channel where a premium position works.
What they did
They attached channel-level Pick Rate and alternative-brand data to the drugstore buyer proposal, and pitched convenience stores separately with a mini-size SKU rather than the full size.
2 chains
Drugstore listings won
8→3 weeks
Listing negotiation
2.4×
Pick Rate gap between channels
Clean beauty · D2CBrand F

Own online store, plus three offline concept stores

The problem
Their own CRM was sophisticated, but what customers looked at once they were in a physical store was a black box.
What TravConnect showed
They shared travpick.club with 1,200 existing customers. Looking at what those customers picked in stores, toner was the most-picked category — and they had no toner line at all.
What they did
Pick data became an input into planning a toner launch, and CRM messaging was segmented by each customer's product interests.
38%
Activation among customers reached
3.2
Picks per person
+19%
Return scans within 30 days

※ Illustrative scenarios based on TravConnect's features. Real results vary by category and store.

BRAND · START

Getting started as a brand: four steps from product upload to campaign

All you need is product information and images. RavenL handles recognition setup and data collection.

1

Open an account

What the brand does

  • Sign up at travconnectglobal.com
  • Enter seller, shipping and return details

What RavenL does

  • A video onboarding session on how to use the dashboard
2

Upload products

What the brand does

  • Product name, category, description and price
  • The 12 mandatory product disclosure items
  • Product imagery per language

What RavenL does

  • Verification of the basics
  • Recognition setup
  • Automatic translation into every locale
3

Share with your customers

Recommended

What the brand does

  • Point your own customers and channels to travpick.club

What RavenL does

  • Their scans and picks flow into your dashboard
4

Analyse and advertise

What the brand does

  • Check Overview and Smart Report weekly
  • Top up the ad wallet and set up campaigns

What RavenL does

  • Smart Report suggests what to improve
  • Campaign performance reporting

What to prepare·Product information · mandatory disclosures · product images (1080px wide, under 2MB)

Shelf data accumulates for whoever starts first

The reason a shopper switched to a competitor disappears unless someone records it.

Whoever records it first owns tomorrow's shelf.

Let's start with today's shelf, together.

travconnectglobal.com · travpick.club · support@ravenl.com

Brand enquiry

Tell us how many products you have and where they are stocked, and we'll come back with a scope and subscription terms.